
The State of Swedish Micromobility 2026
Sweden does not have one micromobility market - but several

The State of Swedish Micromobility 2026
Written by
CEO

National averages hide a fragmented market. Electric bicycles are established, electric Class I mopeds are growing while the fossil fleet declines, and Class II has become a significant part of the insured moped market. Regional differences are substantial and important data gaps remain.
Sweden does not have one micromobility market - but several
National averages hide a fragmented market in which different categories are moving in different directions. Electric bicycles have become firmly established, electric Class I mopeds continue to grow while the fossil fleet declines, and Class II has become a significant part of the insured moped market. At the same time, regional differences are substantial and several important data gaps remain.
The Swedish Micromobility Report 2026 brings together sales data, vehicle registrations, insurance statistics and ten years of regional data to show where the market is growing, where it is shifting and where the available statistics still leave important blind spots.
A market that looks very different beneath the averages
Swedish micromobility is often discussed category by category, with bicycles, e-bikes, e-scooters and mopeds treated as separate markets. When the underlying data is viewed together, however, a more complex picture emerges in which some segments have matured, others are expanding and several are changing shape from within.
Within Moped Class I, for example, electric and fossil-powered vehicles are moving in opposite directions, while Moped Class II has become a substantial part of the insured moped market despite being largely absent from Sweden’s public vehicle-register statistics. Local differences are also large enough to make national averages a poor guide to what is actually happening in different parts of the country.
Moped Class I is really two different markets
The total Class I fleet has barely grown since 2020, but that headline number masks two very different developments. The fossil-powered fleet peaked at 94,200 vehicles in 2020 and has since declined, while electric Class I mopeds have moved in the opposite direction, increasing from 1,766 vehicles in 2015 to 15,415 in 2025.
That represents growth of 773% over ten years, while the electric share of the active Class I fleet has risen from 2.3% to 14.5% over the same period. Since 2020, the entire net increase in the Class I fleet has come from electric vehicles, meaning the overall market would have declined without the continued growth of the electric segment.
Moped Class II is larger than the public vehicle register can show
Moped Class II vehicles are not included in Sweden’s national vehicle register in the same way as Class I, which makes the segment much harder to follow through conventional vehicle statistics. Insurance data therefore provides an important additional view of the market.
At the end of 2025, there were 67,759 traffic-insured Class II mopeds in the TFSY dataset, representing 45% of the combined traffic-insured stock of Class I and Class II mopeds within the same dataset. In 2021, the corresponding share was 37%.
The figures are consistent with a shift in vehicle format within the insured moped market, although the data does not explain what is driving that development. There is currently no national Class II breakdown by fuel type, geography or new sales, which means the role of electrification, changing usage patterns and new product formats cannot yet be quantified.
Geography changes the picture again
The Class I market also varies dramatically across Sweden, particularly at municipal level. In 2025, Öckerö had 38.3 Class I mopeds per 1,000 inhabitants, while Malmö had 2.6, a difference of almost fifteen times.
The pattern is not simply urban versus rural. Several coastal and commuter municipalities have high moped penetration, while many dense urban areas and metropolitan suburbs sit at the lower end of the ranking. The data therefore suggests that the Swedish Class I market cannot be understood through a single national average, particularly for companies making decisions about distribution, retail or service coverage.
Stockholm leads the electrification of Class I
Stockholm County stands out because its market looks very different from the traditional national moped pattern. Overall Class I penetration is relatively low, yet the county has by far the highest electric share in Sweden.
In 2025, 24.9% of the Class I fleet in Stockholm County was electric, compared with 14.5% nationally, while several individual municipalities were considerably higher. Solna reached 45.6%, Danderyd 42.3%, Nacka 39.7% and Stockholm municipality 36.2%.
The result is a clear distinction between where mopeds are most common and where electrification has progressed the furthest. The geography of the traditional moped market and the geography of the electric moped market are not the same.
E-bikes are established while e-scooters face a different challenge
Electric bicycles are one of the clearest examples of a micromobility category becoming firmly established. Sweden sold 94,000 e-bikes in 2025, representing approximately one third of all new bicycles sold, and this has happened while the total bicycle market has more than halved since 2015.
Over the same period, e-bike sales have increased from 30,000 to 94,000 units, suggesting a mature and resilient segment rather than a temporary growth category.
E-scooters present a different picture. Usage continues to spread geographically, but the injury burden is also increasing, with 6,624 people injured in e-scooter accidents in 2025 and seven fatalities recorded during the year. The report does not conclude that risk per trip has increased, because Sweden still lacks sufficient exposure data to measure that reliably, but the growing absolute number of injuries has become an increasingly important part of the segment’s development.
What this means for the industry
The main conclusion is not that Swedish micromobility is simply growing or declining. Rather, the market is shifting between vehicle formats, technologies, geographies and use cases, with those changes often hidden by national headline figures.
For manufacturers, distributors, retailers, fleet operators, investors and public-sector decision makers, this means national averages are increasingly insufficient. Understanding the market requires looking at the underlying segments separately and recognising that a strong market signal in one category or region may not apply elsewhere.
About the report
The Swedish Micromobility Report 2026 analyses e-bike sales and market development, private e-scooter usage and safety, Moped Class I development from 2015 to 2025, electric versus fossil Class I mopeds, county and municipal differences, Moped Class II insurance data, market structure, seasonality, data gaps and the outlook for 2026–2028.
The analysis draws on data from Trafikanalys, Transportstyrelsen, Statistics Sweden, Svensk Cykling / Cykelbranschen and Svensk Försäkring / TFSY. Where the available data does not support a conclusion, the report identifies the limitation rather than filling the gap with estimates.
Download the full report
Explore the full analysis, methodology and underlying data.
→ Download the report in English
→ Ladda ner rapporten på svenska
About The Electric Company
The Electric Company Europe AB works across the micromobility value chain, including distribution, spare parts, service, retail, fulfilment and B2B mobility. The report is part of our work to build a more data-driven understanding of the market we operate in and to contribute to a clearer discussion about how Swedish micromobility is actually developing.
The State of Swedish Micromobility 2026
Sweden does not have one micromobility market - but several
The State of Swedish Micromobility 2026
Written by
CEO
National averages hide a fragmented market. Electric bicycles are established, electric Class I mopeds are growing while the fossil fleet declines, and Class II has become a significant part of the insured moped market. Regional differences are substantial and important data gaps remain.
Sweden does not have one micromobility market - but several
National averages hide a fragmented market in which different categories are moving in different directions. Electric bicycles have become firmly established, electric Class I mopeds continue to grow while the fossil fleet declines, and Class II has become a significant part of the insured moped market. At the same time, regional differences are substantial and several important data gaps remain.
The Swedish Micromobility Report 2026 brings together sales data, vehicle registrations, insurance statistics and ten years of regional data to show where the market is growing, where it is shifting and where the available statistics still leave important blind spots.
A market that looks very different beneath the averages
Swedish micromobility is often discussed category by category, with bicycles, e-bikes, e-scooters and mopeds treated as separate markets. When the underlying data is viewed together, however, a more complex picture emerges in which some segments have matured, others are expanding and several are changing shape from within.
Within Moped Class I, for example, electric and fossil-powered vehicles are moving in opposite directions, while Moped Class II has become a substantial part of the insured moped market despite being largely absent from Sweden’s public vehicle-register statistics. Local differences are also large enough to make national averages a poor guide to what is actually happening in different parts of the country.
Moped Class I is really two different markets
The total Class I fleet has barely grown since 2020, but that headline number masks two very different developments. The fossil-powered fleet peaked at 94,200 vehicles in 2020 and has since declined, while electric Class I mopeds have moved in the opposite direction, increasing from 1,766 vehicles in 2015 to 15,415 in 2025.
That represents growth of 773% over ten years, while the electric share of the active Class I fleet has risen from 2.3% to 14.5% over the same period. Since 2020, the entire net increase in the Class I fleet has come from electric vehicles, meaning the overall market would have declined without the continued growth of the electric segment.
Moped Class II is larger than the public vehicle register can show
Moped Class II vehicles are not included in Sweden’s national vehicle register in the same way as Class I, which makes the segment much harder to follow through conventional vehicle statistics. Insurance data therefore provides an important additional view of the market.
At the end of 2025, there were 67,759 traffic-insured Class II mopeds in the TFSY dataset, representing 45% of the combined traffic-insured stock of Class I and Class II mopeds within the same dataset. In 2021, the corresponding share was 37%.
The figures are consistent with a shift in vehicle format within the insured moped market, although the data does not explain what is driving that development. There is currently no national Class II breakdown by fuel type, geography or new sales, which means the role of electrification, changing usage patterns and new product formats cannot yet be quantified.
Geography changes the picture again
The Class I market also varies dramatically across Sweden, particularly at municipal level. In 2025, Öckerö had 38.3 Class I mopeds per 1,000 inhabitants, while Malmö had 2.6, a difference of almost fifteen times.
The pattern is not simply urban versus rural. Several coastal and commuter municipalities have high moped penetration, while many dense urban areas and metropolitan suburbs sit at the lower end of the ranking. The data therefore suggests that the Swedish Class I market cannot be understood through a single national average, particularly for companies making decisions about distribution, retail or service coverage.
Stockholm leads the electrification of Class I
Stockholm County stands out because its market looks very different from the traditional national moped pattern. Overall Class I penetration is relatively low, yet the county has by far the highest electric share in Sweden.
In 2025, 24.9% of the Class I fleet in Stockholm County was electric, compared with 14.5% nationally, while several individual municipalities were considerably higher. Solna reached 45.6%, Danderyd 42.3%, Nacka 39.7% and Stockholm municipality 36.2%.
The result is a clear distinction between where mopeds are most common and where electrification has progressed the furthest. The geography of the traditional moped market and the geography of the electric moped market are not the same.
E-bikes are established while e-scooters face a different challenge
Electric bicycles are one of the clearest examples of a micromobility category becoming firmly established. Sweden sold 94,000 e-bikes in 2025, representing approximately one third of all new bicycles sold, and this has happened while the total bicycle market has more than halved since 2015.
Over the same period, e-bike sales have increased from 30,000 to 94,000 units, suggesting a mature and resilient segment rather than a temporary growth category.
E-scooters present a different picture. Usage continues to spread geographically, but the injury burden is also increasing, with 6,624 people injured in e-scooter accidents in 2025 and seven fatalities recorded during the year. The report does not conclude that risk per trip has increased, because Sweden still lacks sufficient exposure data to measure that reliably, but the growing absolute number of injuries has become an increasingly important part of the segment’s development.
What this means for the industry
The main conclusion is not that Swedish micromobility is simply growing or declining. Rather, the market is shifting between vehicle formats, technologies, geographies and use cases, with those changes often hidden by national headline figures.
For manufacturers, distributors, retailers, fleet operators, investors and public-sector decision makers, this means national averages are increasingly insufficient. Understanding the market requires looking at the underlying segments separately and recognising that a strong market signal in one category or region may not apply elsewhere.
About the report
The Swedish Micromobility Report 2026 analyses e-bike sales and market development, private e-scooter usage and safety, Moped Class I development from 2015 to 2025, electric versus fossil Class I mopeds, county and municipal differences, Moped Class II insurance data, market structure, seasonality, data gaps and the outlook for 2026–2028.
The analysis draws on data from Trafikanalys, Transportstyrelsen, Statistics Sweden, Svensk Cykling / Cykelbranschen and Svensk Försäkring / TFSY. Where the available data does not support a conclusion, the report identifies the limitation rather than filling the gap with estimates.
Download the full report
Explore the full analysis, methodology and underlying data.
→ Download the report in English
→ Ladda ner rapporten på svenska
About The Electric Company
The Electric Company Europe AB works across the micromobility value chain, including distribution, spare parts, service, retail, fulfilment and B2B mobility. The report is part of our work to build a more data-driven understanding of the market we operate in and to contribute to a clearer discussion about how Swedish micromobility is actually developing.
The State of Swedish Micromobility 2026
Sweden does not have one micromobility market - but several
The State of Swedish Micromobility 2026
Written by
CEO
National averages hide a fragmented market. Electric bicycles are established, electric Class I mopeds are growing while the fossil fleet declines, and Class II has become a significant part of the insured moped market. Regional differences are substantial and important data gaps remain.
Sweden does not have one micromobility market - but several
National averages hide a fragmented market in which different categories are moving in different directions. Electric bicycles have become firmly established, electric Class I mopeds continue to grow while the fossil fleet declines, and Class II has become a significant part of the insured moped market. At the same time, regional differences are substantial and several important data gaps remain.
The Swedish Micromobility Report 2026 brings together sales data, vehicle registrations, insurance statistics and ten years of regional data to show where the market is growing, where it is shifting and where the available statistics still leave important blind spots.
A market that looks very different beneath the averages
Swedish micromobility is often discussed category by category, with bicycles, e-bikes, e-scooters and mopeds treated as separate markets. When the underlying data is viewed together, however, a more complex picture emerges in which some segments have matured, others are expanding and several are changing shape from within.
Within Moped Class I, for example, electric and fossil-powered vehicles are moving in opposite directions, while Moped Class II has become a substantial part of the insured moped market despite being largely absent from Sweden’s public vehicle-register statistics. Local differences are also large enough to make national averages a poor guide to what is actually happening in different parts of the country.
Moped Class I is really two different markets
The total Class I fleet has barely grown since 2020, but that headline number masks two very different developments. The fossil-powered fleet peaked at 94,200 vehicles in 2020 and has since declined, while electric Class I mopeds have moved in the opposite direction, increasing from 1,766 vehicles in 2015 to 15,415 in 2025.
That represents growth of 773% over ten years, while the electric share of the active Class I fleet has risen from 2.3% to 14.5% over the same period. Since 2020, the entire net increase in the Class I fleet has come from electric vehicles, meaning the overall market would have declined without the continued growth of the electric segment.
Moped Class II is larger than the public vehicle register can show
Moped Class II vehicles are not included in Sweden’s national vehicle register in the same way as Class I, which makes the segment much harder to follow through conventional vehicle statistics. Insurance data therefore provides an important additional view of the market.
At the end of 2025, there were 67,759 traffic-insured Class II mopeds in the TFSY dataset, representing 45% of the combined traffic-insured stock of Class I and Class II mopeds within the same dataset. In 2021, the corresponding share was 37%.
The figures are consistent with a shift in vehicle format within the insured moped market, although the data does not explain what is driving that development. There is currently no national Class II breakdown by fuel type, geography or new sales, which means the role of electrification, changing usage patterns and new product formats cannot yet be quantified.
Geography changes the picture again
The Class I market also varies dramatically across Sweden, particularly at municipal level. In 2025, Öckerö had 38.3 Class I mopeds per 1,000 inhabitants, while Malmö had 2.6, a difference of almost fifteen times.
The pattern is not simply urban versus rural. Several coastal and commuter municipalities have high moped penetration, while many dense urban areas and metropolitan suburbs sit at the lower end of the ranking. The data therefore suggests that the Swedish Class I market cannot be understood through a single national average, particularly for companies making decisions about distribution, retail or service coverage.
Stockholm leads the electrification of Class I
Stockholm County stands out because its market looks very different from the traditional national moped pattern. Overall Class I penetration is relatively low, yet the county has by far the highest electric share in Sweden.
In 2025, 24.9% of the Class I fleet in Stockholm County was electric, compared with 14.5% nationally, while several individual municipalities were considerably higher. Solna reached 45.6%, Danderyd 42.3%, Nacka 39.7% and Stockholm municipality 36.2%.
The result is a clear distinction between where mopeds are most common and where electrification has progressed the furthest. The geography of the traditional moped market and the geography of the electric moped market are not the same.
E-bikes are established while e-scooters face a different challenge
Electric bicycles are one of the clearest examples of a micromobility category becoming firmly established. Sweden sold 94,000 e-bikes in 2025, representing approximately one third of all new bicycles sold, and this has happened while the total bicycle market has more than halved since 2015.
Over the same period, e-bike sales have increased from 30,000 to 94,000 units, suggesting a mature and resilient segment rather than a temporary growth category.
E-scooters present a different picture. Usage continues to spread geographically, but the injury burden is also increasing, with 6,624 people injured in e-scooter accidents in 2025 and seven fatalities recorded during the year. The report does not conclude that risk per trip has increased, because Sweden still lacks sufficient exposure data to measure that reliably, but the growing absolute number of injuries has become an increasingly important part of the segment’s development.
What this means for the industry
The main conclusion is not that Swedish micromobility is simply growing or declining. Rather, the market is shifting between vehicle formats, technologies, geographies and use cases, with those changes often hidden by national headline figures.
For manufacturers, distributors, retailers, fleet operators, investors and public-sector decision makers, this means national averages are increasingly insufficient. Understanding the market requires looking at the underlying segments separately and recognising that a strong market signal in one category or region may not apply elsewhere.
About the report
The Swedish Micromobility Report 2026 analyses e-bike sales and market development, private e-scooter usage and safety, Moped Class I development from 2015 to 2025, electric versus fossil Class I mopeds, county and municipal differences, Moped Class II insurance data, market structure, seasonality, data gaps and the outlook for 2026–2028.
The analysis draws on data from Trafikanalys, Transportstyrelsen, Statistics Sweden, Svensk Cykling / Cykelbranschen and Svensk Försäkring / TFSY. Where the available data does not support a conclusion, the report identifies the limitation rather than filling the gap with estimates.
Download the full report
Explore the full analysis, methodology and underlying data.
→ Download the report in English
→ Ladda ner rapporten på svenska
About The Electric Company
The Electric Company Europe AB works across the micromobility value chain, including distribution, spare parts, service, retail, fulfilment and B2B mobility. The report is part of our work to build a more data-driven understanding of the market we operate in and to contribute to a clearer discussion about how Swedish micromobility is actually developing.

We build what powers the shift.
Infrastructure for iconic electric machines.
Building and scaling electric infrastructure across brands, distribution and service.
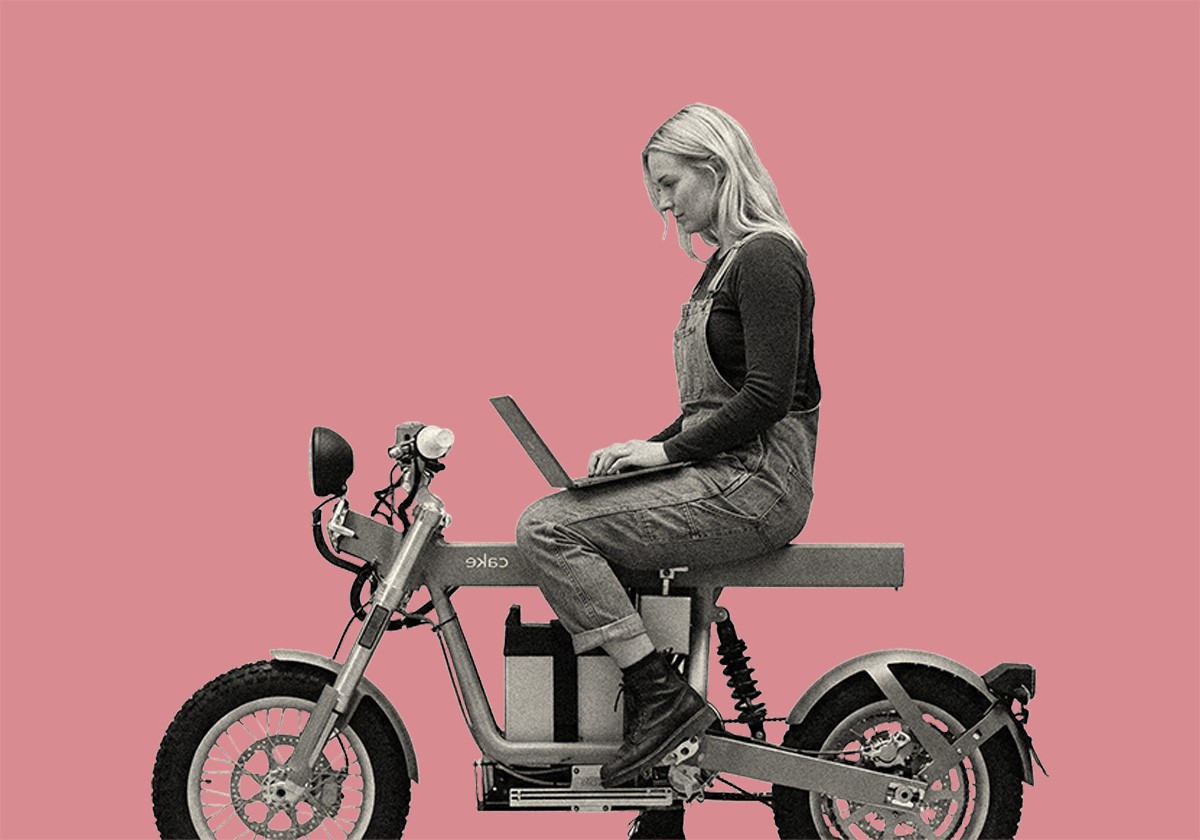
We build what powers the shift.
Infrastructure for iconic electric machines.
Building and scaling electric infrastructure across brands, distribution and service.
We build what powers the shift.
Infrastructure for iconic electric machines.
Building and scaling electric infrastructure across brands, distribution and service.